Trade analytics refers to the use of data analysis and statistical techniques to gain insights into trading activities and market trends. It involves the examination and interpretation of various data points related to financial instruments, such as stocks, bonds, commodities, and currencies, to make informed decisions and optimize trading strategies.
Key components of trade analytics include:
Market Data Analysis: Analyzing historical and real-time market data, such as price movements, trading volumes, bid-ask spreads, and other relevant metrics, to identify patterns and trends.
Risk Management: Assessing and managing the potential risks associated with trading activities. This includes evaluating the volatility of assets, calculating Value at Risk (VaR), and implementing risk mitigation strategies.
Performance Measurement: Evaluating the performance of a trading strategy or portfolio over time. This involves comparing actual results with expected outcomes, measuring returns, and assessing the impact of various factors on trading performance.
Algorithmic Trading: Applying quantitative models and algorithms to automate trading decisions. Trade analytics play a crucial role in the development, testing, and optimization of algorithmic trading strategies.
Transaction Cost Analysis (TCA): Evaluating the costs associated with executing trades, including factors such as slippage, market impact, and brokerage fees. TCA helps traders optimize execution strategies to minimize transaction costs.
Sentiment Analysis: Monitoring and analyzing market sentiment through social media, news, and other sources to gauge the overall mood and potential impact on trading decisions.
Machine Learning and Predictive Analytics: Utilizing advanced analytics techniques, such as machine learning, to identify predictive patterns and signals in the market, helping traders make more informed decisions.
Trade analytics is particularly important for institutional investors, hedge funds, asset managers, and other financial institutions that engage in complex trading strategies and manage large portfolios. By using data and analytics, traders can enhance their decision-making processes, identify opportunities, and mitigate risks in the dynamic and competitive financial markets.
Examples of firms that have benefited from trade analytics:
Numerous financial firms and institutions implement trade analytics to enhance their decision-making processes and optimize trading strategies. Here are a few examples of firms that have benefited from trade analytics:
High-Frequency Trading Firms:
Firms engaged in high-frequency trading, such as Virtu Financial and Citadel Securities, heavily rely on trade analytics. These firms use sophisticated algorithms and quantitative models to analyze market data in real-time, identify patterns, and execute trades at extremely high speeds. The benefits include improved execution efficiency, reduced trading costs, and the ability to capitalize on fleeting market opportunities.
Hedge Funds:
Hedge funds, like Renaissance Technologies, are known for employing quantitative strategies backed by extensive trade analytics. These funds use historical and real-time market data to develop and refine algorithmic trading models. The result is improved risk management, better performance, and the ability to generate alpha (excess returns) in various market conditions.
Asset Management Companies:
Asset management firms, such as BlackRock, leverage trade analytics to optimize portfolio management. By analyzing market trends, performance metrics, and risk factors, these firms can make informed investment decisions, adjust portfolio allocations, and enhance overall returns for their clients.
Investment Banks:
Investment banks, like Goldman Sachs, utilize trade analytics across various departments, including trading desks and investment research. Trade analytics help these banks assess market conditions, evaluate the impact of economic events, and provide clients with valuable insights for their investment decisions.
Commodity Trading Firms:
Companies involved in commodity trading, such as Glencore, employ trade analytics to navigate the complex and volatile commodity markets. By analyzing supply and demand dynamics, price trends, and geopolitical factors, these firms can optimize their trading strategies, manage inventory effectively, and mitigate risks associated with commodity price fluctuations.
Retail Brokerages:
Retail brokerages, like Charles Schwab or E*TRADE, use trade analytics to offer their clients tools for analyzing market trends, executing trades, and managing portfolios. Retail investors benefit from the insights provided by these platforms, helping them make more informed decisions in their trading activities.
The common thread among these examples is the use of trade analytics to gain a competitive edge, whether it’s through high-frequency trading, algorithmic strategies, portfolio optimization, or risk management. By using data and advanced analytics, these firms can adapt to changing market conditions, identify opportunities, and make more informed decisions, ultimately leading to improved financial performance.
Tools and platforms used for Trade Analytics:
Several tools and platforms are widely used for trade analytics, catering to various aspects of data analysis, market research, and strategy development. Here are some of the top tools used for trade analytics:
Bloomberg Terminal:
Bloomberg is a comprehensive platform widely used by financial professionals. The Bloomberg Terminal provides real-time market data, news, analytics, and a range of financial tools. Traders and analysts use Bloomberg for market research, economic analysis, and monitoring financial instruments.
Reuters Eikon:
Reuters Eikon is a financial information platform that offers market data, news, and analytics. It provides tools for charting, technical analysis, and financial modeling. Eikon is used by traders, analysts, and financial professionals for decision-making and research.
FactSet:
FactSet is a financial data and analytics platform used by investment professionals for equity research, portfolio analysis, and risk management. It offers a wide range of data, including fundamental and market data, as well as tools for financial modeling.
Morningstar Direct:
Morningstar Direct is a platform that provides investment research, analytics, and data on various financial instruments. It is commonly used by asset managers, investment advisors, and institutional investors for portfolio analysis and investment decision-making.
TIBCO Spotfire:
TIBCO Spotfire is a data visualization and analytics platform that allows users to explore, analyze, and visualize complex datasets. It is used in trade analytics for creating interactive dashboards, conducting exploratory data analysis, and gaining insights from large datasets.
Tableau:
Tableau is a popular data visualization tool that enables users to create interactive and shareable dashboards. Traders and analysts use Tableau to visualize market data, identify patterns, and communicate insights effectively.
QuantConnect:
QuantConnect is a cloud-based algorithmic trading platform that allows users to develop, test, and deploy trading algorithms. It supports multiple programming languages and provides access to historical and real-time market data.
MetaTrader 4/5:
MetaTrader is a widely used trading platform in the retail forex and CFD markets. It offers charting tools, technical analysis, and automated trading capabilities. Traders use MetaTrader to execute trades and analyze market movements.
Interactive Brokers (IBKR) Trader Workstation:
Interactive Brokers provides a powerful trading platform called Trader Workstation (TWS). It offers advanced trading tools, real-time market data, and portfolio analysis features. It is widely used by active traders and institutional investors.
Alteryx:
Alteryx is a data blending and analytics platform that allows users to prepare, blend, and analyze data from various sources. It is used in trade analytics for data preprocessing, cleaning, and preparation before analysis.
These tools cater to different needs within the trade analytics process, from market data analysis and visualization to algorithmic trading development and risk management. The choice of a specific tool often depends on the specific requirements and preferences of the individual or organization using it.

Trade analytics benefits in financial markets:
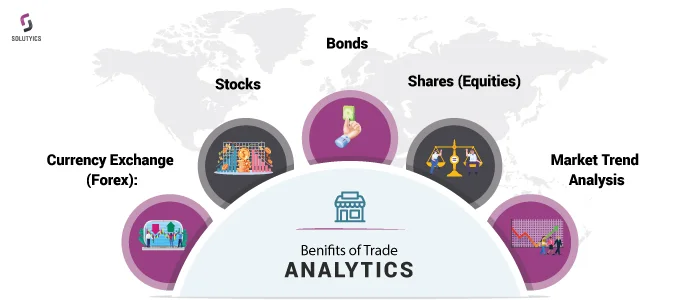
Trade analytics can provide substantial benefits in various financial markets, including currency exchange, stocks, bonds, and shares. Here’s how trade analytics can be advantageous in each of these areas:
Currency Exchange (Forex):
Market Trend Analysis: Trade analytics can help identify trends in currency exchange rates by analyzing historical and real-time market data. This assists traders in making informed decisions about whether to buy or sell a particular currency pair.
Volatility Assessment: By analyzing volatility patterns, traders can assess the risk associated with currency pairs. This information is crucial for developing risk management strategies and setting appropriate stop-loss levels.
Algorithmic Trading: Trade analytics plays a key role in developing and optimizing algorithmic trading strategies in the highly liquid and fast-paced forex market. Algorithms can take advantage of market inefficiencies and execute trades with precision.
Stocks:
Technical Analysis: Trade analytics is widely used for technical analysis in the stock market. Traders analyze historical price movements, trading volumes, and various technical indicators to identify potential entry and exit points.
Portfolio Optimization: By employing analytics tools, investors can optimize their stock portfolios. This involves analyzing the historical performance of stocks, assessing risk, and adjusting portfolio allocations to achieve better returns for a given level of risk.
News and Sentiment Analysis: Trade analytics can include sentiment analysis of news articles and social media to gauge market sentiment. This information is valuable for understanding how news and public opinion might impact stock prices.
Bonds:
Yield Curve Analysis: Trade analytics aids in analyzing the yield curve, which is crucial for bond investors. Understanding the yield curve helps investors make decisions about the interest rate environment and the potential risks and rewards associated with different maturities.
Credit Risk Assessment: For bond investors, trade analytics can assist in evaluating credit risk. By analyzing historical data and financial metrics, investors can assess the creditworthiness of bond issuers and make more informed investment decisions.
Shares (Equities):
Earnings Analysis: Trade analytics helps analyze corporate earnings reports and financial statements, providing insights into the financial health and performance of companies. This information is vital for equity investors making investment decisions.
Dividend Yield Analysis: For investors seeking income from their investments, trade analytics can assist in analyzing dividend yields. This involves assessing a company’s dividend history and financial stability.
Event-driven Trading: Traders can use trade analytics to identify and react to market-moving events, such as earnings announcements, mergers and acquisitions, and economic reports, to capitalize on short-term price movements.
Trade analytics is a versatile tool that can benefit participants in various financial markets. It provides insights into market trends, risk management, and investment opportunities, enabling traders and investors to make more informed decisions and optimize their strategies for different asset classes, including currencies, stocks, bonds, and shares.

Elevate your trading strategies with Solutyics’ Trading Analytics Services. Unlock market insights, optimize risk management, and achieve algorithmic trading excellence. Contact us now for a data-driven edge in the financial markets. Maximize your returns with Solutyics.
Explore valuable insights in our latest analytics blogs:
Trade Analytics: Gain a deeper understanding of successful trade strategies. Read more
Quality Analytics: Elevate your standards with data-driven quality insights. Read more
Banking Analytics: Navigate the finance landscape with precision and foresight. Read more
Cybersecurity Predictive Analytics: Stay ahead in the digital realm with proactive cybersecurity insights. Read more
Supply Chain Predictive Analytics: Optimize your supply chain for maximum efficiency. Read more
Empower your business with knowledge. Click the links and stay informed.
Conclusion:
In conclusion, trade analytics stands as a pivotal tool across diverse financial markets, offering valuable insights and strategic advantages. From currency exchange and stocks to bonds and equities, the application of data analysis and statistical techniques has proven instrumental for informed decision-making, risk mitigation, and the optimization of trading strategies. Firms ranging from high-frequency trading giants like Virtu Financial to renowned hedge funds like Renaissance Technologies, asset management companies like BlackRock, and retail brokerages like Charles Schwab have all reaped substantial benefits from the implementation of trade analytics.
Through the utilization of sophisticated tools and platforms such as Bloomberg Terminal, Reuters Eikon, and TIBCO Spotfire, these entities have gained a competitive edge, demonstrating the power of data-driven decision-making in navigating dynamic and complex financial landscapes. The versatility of trade analytics continues to reshape the landscape of financial trading, empowering traders, investors, and institutions alike to adapt, identify opportunities, and optimize performance in an ever-evolving market environment.
FAQs
1: How can organizations develop a comprehensive cybersecurity strategy for Critical Infrastructure (CPS)?
Identify Assets and Vulnerabilities:
Begin by conducting a thorough inventory of all operational technology (OT) and internet of things (IoT) assets and assess vulnerabilities associated with each asset to understand potential entry points for cyber threats.
Holistic Risk Management:
Develop a holistic approach to risk management by considering both data classification schemes and the impact on human life. Then, Integrate risk assessments that model potential consequences to human safety, ensuring a comprehensive understanding of the risks involved.
Continuous Monitoring and Adaptation:
Implement continuous monitoring mechanisms to stay vigilant against evolving cyber threats. Furthermore it regularly update the cybersecurity strategy to adapt to emerging threats and technological changes.
2: How can organizations enhance risk and impact assessments in the realm of CPS cybersecurity?
Modeling Impact to Human Life:
Integrate impact assessments that go beyond data classification schemes, considering the potential harm to human life. Develop scenarios that simulate the consequences of a cybersecurity breach on both data integrity and human safety.
Data Classification and Sensitivity:
Implement a mature data classification scheme to categorize information based on its sensitivity. Link data classification levels to potential impacts, allowing for a more nuanced understanding of the risks associated with different types of data.
Continuous Improvement:
Establish a feedback loop for risk assessments, incorporating lessons learned from incidents to continuously improve risk assessment models. Regularly update risk assessments to reflect changes in the threat landscape and the organization’s technological environment.
3: How can organizations align their cybersecurity governance with emerging directives for critical infrastructure?
Incorporation of Directives:
Stay informed about emerging cybersecurity directives specific to critical infrastructure. Furethermore, regularly review and update governance frameworks to align with the latest regulatory and industry-specific cybersecurity requirements.
Cross-Functional Collaboration:
Foster collaboration between cybersecurity teams and other relevant departments to ensure a unified approach to compliance. Then Establish communication channels to promptly disseminate and implement new directives throughout the organization.
Periodic Compliance Audits:
Conduct periodic audits to assess the organization’s adherence to emerging directives and use audit findings to identify areas for improvement and ensure ongoing compliance with evolving cybersecurity standards.
Author
Team Solutyics is a dynamic group of Analytics and AI specialists who bring together a rich mix of expertise. Their combined insights ensure that readers gain a deeper understanding of practical applications of Analytics and AI.

Comments (2)
I was recommended this website by my cousin I am not sure whether this post is written by him as nobody else know such detailed about my difficulty You are wonderful Thanks
Hi there to all, for the reason that I am genuinely keen of reading this website’s post to be updated on a regular basis. It carries pleasant stuff.